class: center, middle, inverse, title-slide # Data visualization review ### Dr. Dogucu ### 2020-01-22 --- layout: true <div class="my-header"></div> <div class="my-footer"> Copyright © <a href="https://mdogucu.ics.uci.edu">Dr. Mine Dogucu</a>. All Rights Reserved.</div> --- ## Review Which R functions do you recall from last discussion? What is the shortcut for `%>%`? --- ## Data We will be using `titanic_train` dataset from the `titanic` package. Glimpse at the data. Does everything look like it should? --- ## Who uses ggplot? Some examples [BBC](https://bbc.github.io/rcookbook/) [FiveThirtyEight](https://fivethirtyeight.com/features/the-rise-of-religiously-inspired-terrorism-in-france/) [Master List](http://r-statistics.co/Top50-Ggplot2-Visualizations-MasterList-R-Code.html#Histogram) --- ## Three steps of basic visualization with ggplot2 package 1. Make some space (this soon will make sense) using the `ggplot()` function. 2. Draw your axes using `aes()` function. 3. Add your plot, whether it is histogram, bar plot or something else. We will call these geom objects. --- ## Planning for ggplot For every plot, 1) Decide, what variables to use. 2) Decide which variable is on which axes. 3) Decide what kind of plot it is. --- ``` ## `stat_bin()` using `bins = 30`. Pick better value with `binwidth`. ``` <img src="slide-3d-viz-data_files/figure-html/unnamed-chunk-2-1.png" style="display: block; margin: auto;" /> Why are we getting this warning? --- <img src="slide-3d-viz-data_files/figure-html/unnamed-chunk-3-1.png" style="display: block; margin: auto;" /> What step of the code is binwidth related to? --- ## Cheatsheet Look at the ggplot cheatsheet. Moving on you will attempt at making the plot by finding the geom object from your cheatsheet. --- <br> <br> <br> <img src="slide-3d-viz-data_files/figure-html/unnamed-chunk-4-1.png" style="display: block; margin: auto;" /> --- ## You Attempt This First Make a plot that shows the relationship between age of the passenger and the fare that they paid. Comment whether older passengers bought more expensive tickets. --- <img src="slide-3d-viz-data_files/figure-html/unnamed-chunk-5-1.png" style="display: block; margin: auto;" /> --- ## Color ```r titanic_train %>% ggplot(aes(x = Fare )) + geom_histogram(color = "salmon") ``` ``` ## `stat_bin()` using `bins = 30`. Pick better value with `binwidth`. ``` 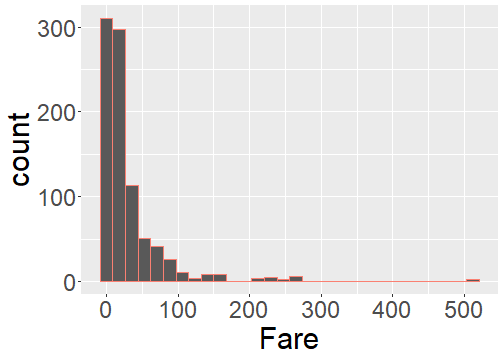<!-- --> --- ## Fill ```r titanic_train %>% ggplot(aes(x = Fare)) + geom_histogram(fill = "salmon") ``` ``` ## `stat_bin()` using `bins = 30`. Pick better value with `binwidth`. ``` 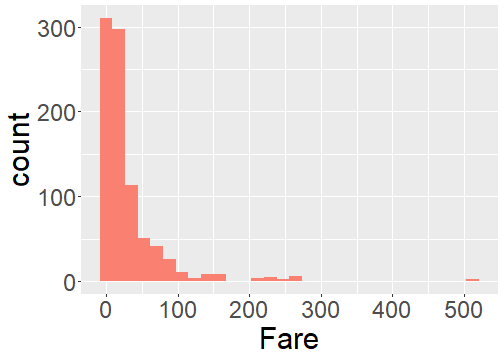<!-- --> --- ## Shape ```r titanic_train %>% ggplot(aes(x = Age, y = Fare )) + geom_point(shape = 4) ``` <img src="slide-3d-viz-data_files/figure-html/unnamed-chunk-11-1.png" style="display: block; margin: auto;" /> --- class: center, inverse ## More colors <br> <br> <br> [bit.ly/colors-r](http:/bit.ly/colors-r) --- class: center, inverse ## More shapes <br> <br> <br> [bit.ly/shapes-r](http:/bit.ly/shapes-r) --- ## Stacked bar plot Can you guess where the fill argument will go for this stacked bar plot? <img src="slide-3d-viz-data_files/figure-html/unnamed-chunk-12-1.png" style="display: block; margin: auto;" />