Continous Distributions
Dr. Mine Dogucu
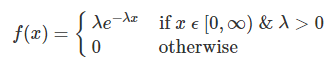
Exponential Distribution
\(X \sim \text{Exp}(\lambda)\)
Expected Value and Variance
\(E(X) = \frac{1}{\lambda}\)
\(Var(X) = \frac{1}{\lambda^2}\)
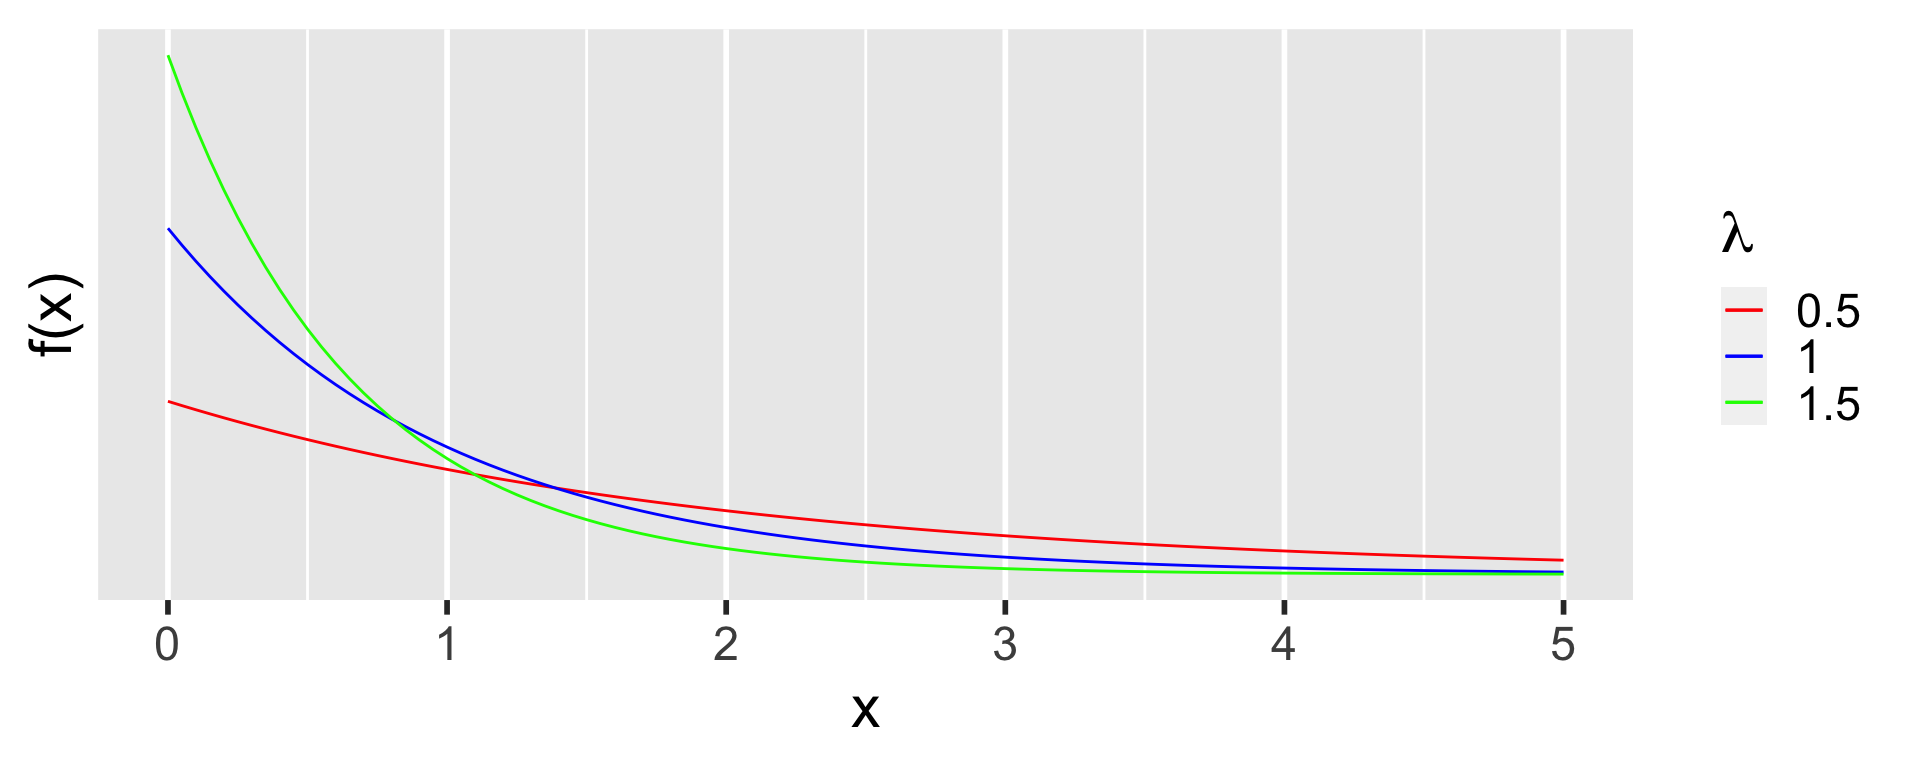
Example
Suppose your waiting time (in minutes) for a bus is \(X \sim Exp(0.1)\).
\(f(x) =0.1 e^{-0.1 x} \text{ for } \ x \ \epsilon \ [0, \infty)\)
\(f(10) =0.1 e^{-0.1\cdot10}\)
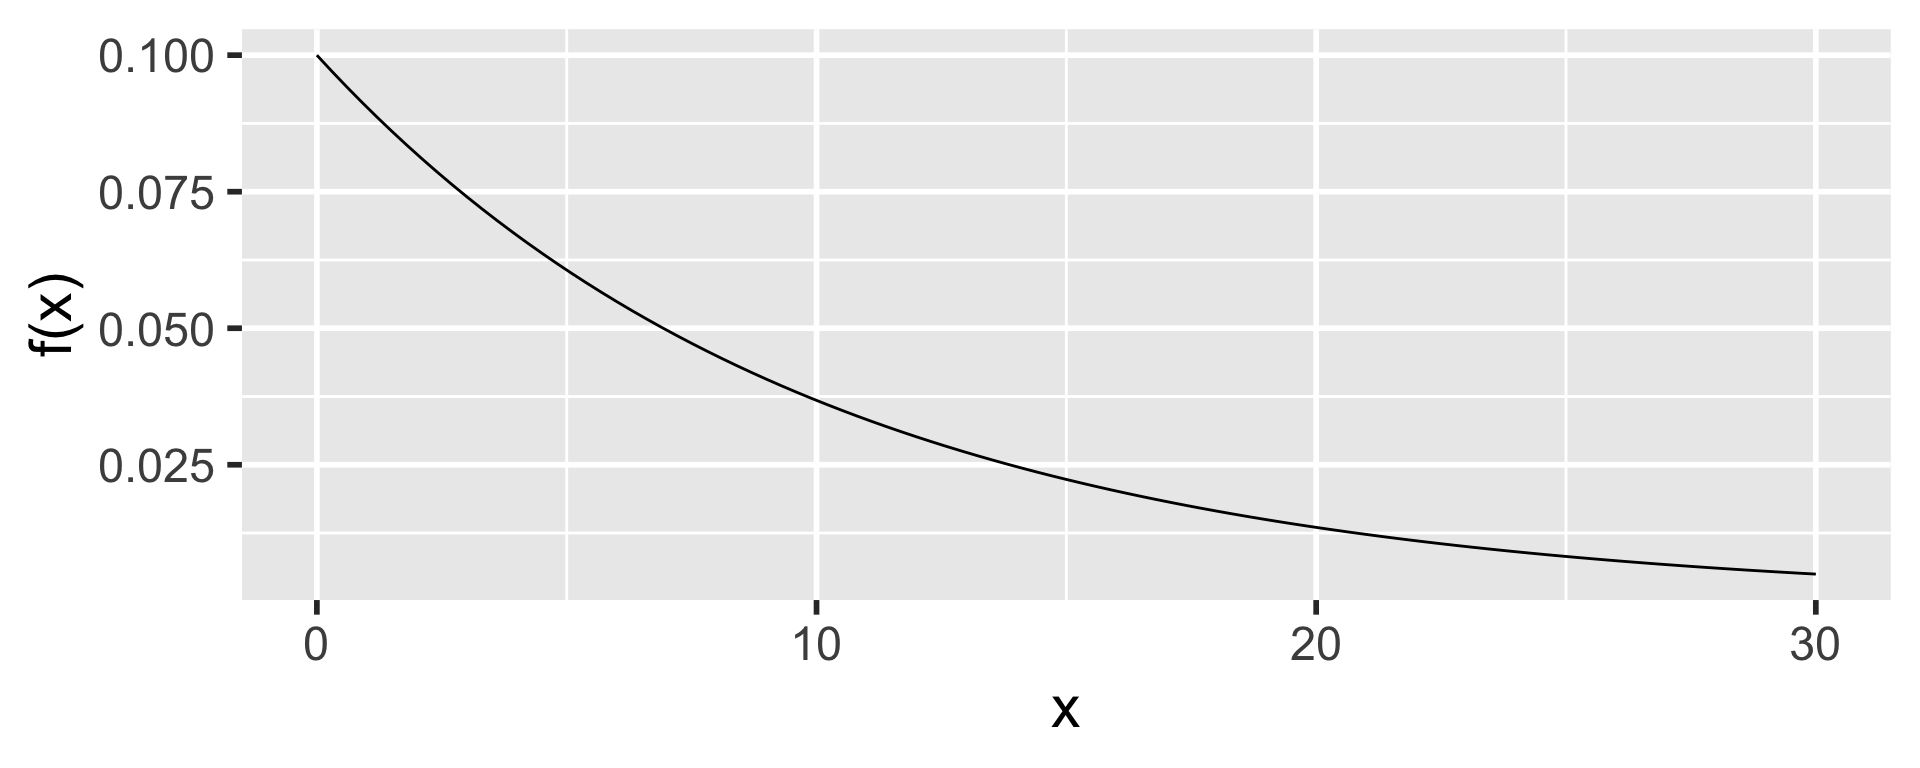
Calculating Probability
You show up at the bus stop. What is the probability that you will wait for 10 minutes for the bus?
\(P(X = 10) = 0\)
\(\int_{10}^{10}\lambda e^{-\lambda x}dx\)
Calculating Probability
What is the probability that you will wait for the bus less than 10 minutes?
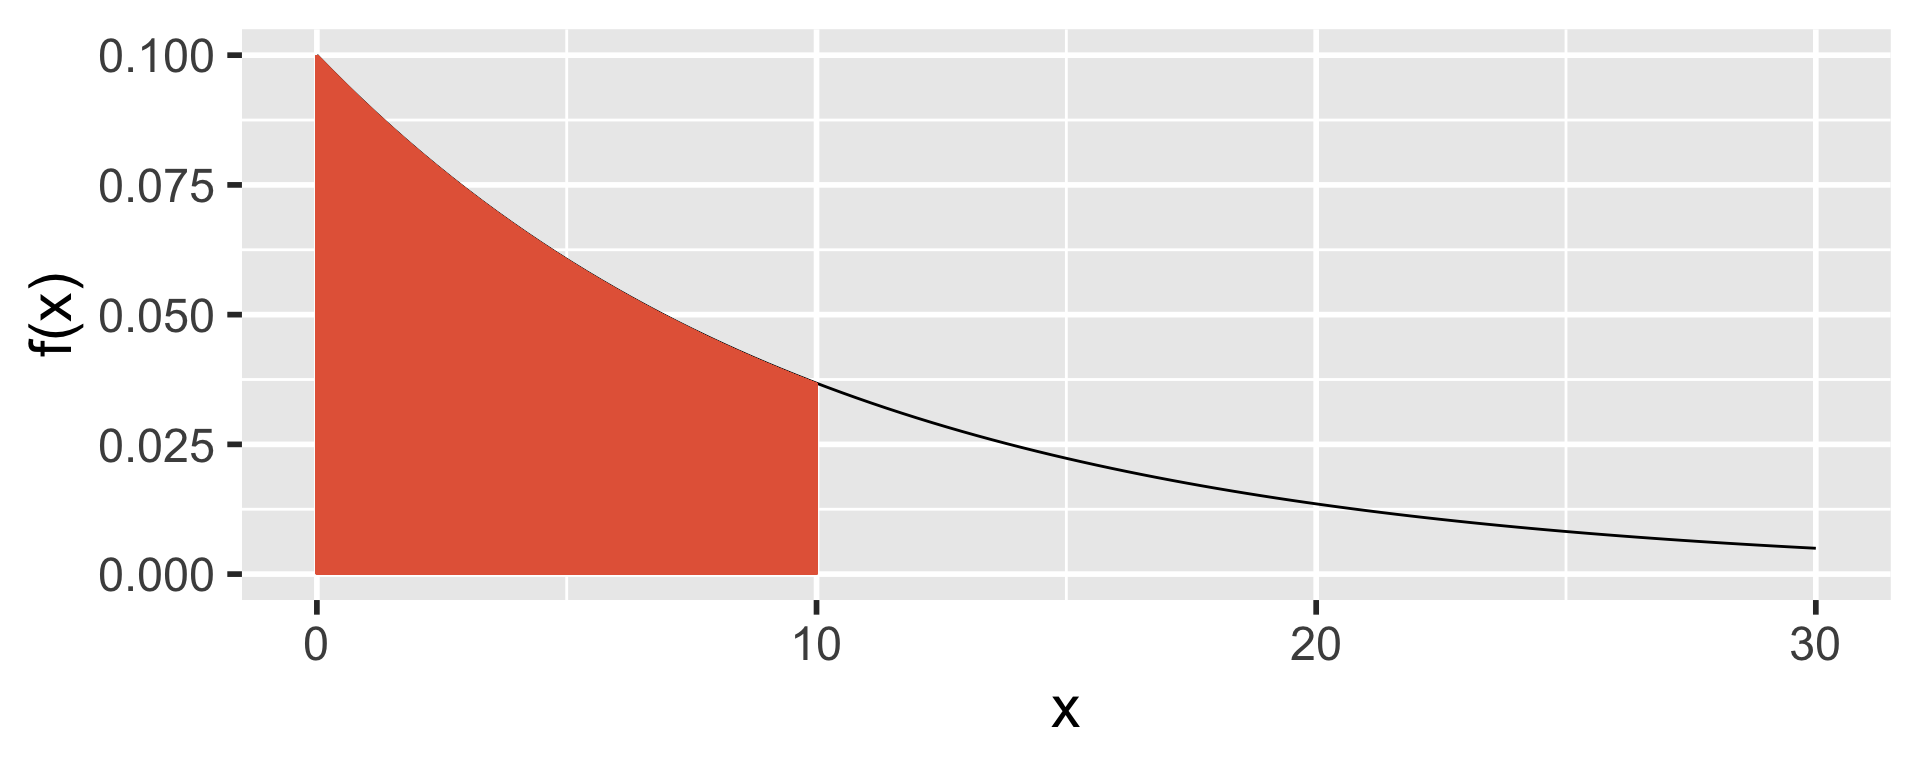
Cumulative probability!
\(\int_{0}^{10}\lambda e^{-\lambda x}dx\)
\(\int_{0}^{10}0.1 e^{-0.1 x}dx\)
Calculating Probability
What is the probability that you will wait between 10 to 20 minutes for the bus?
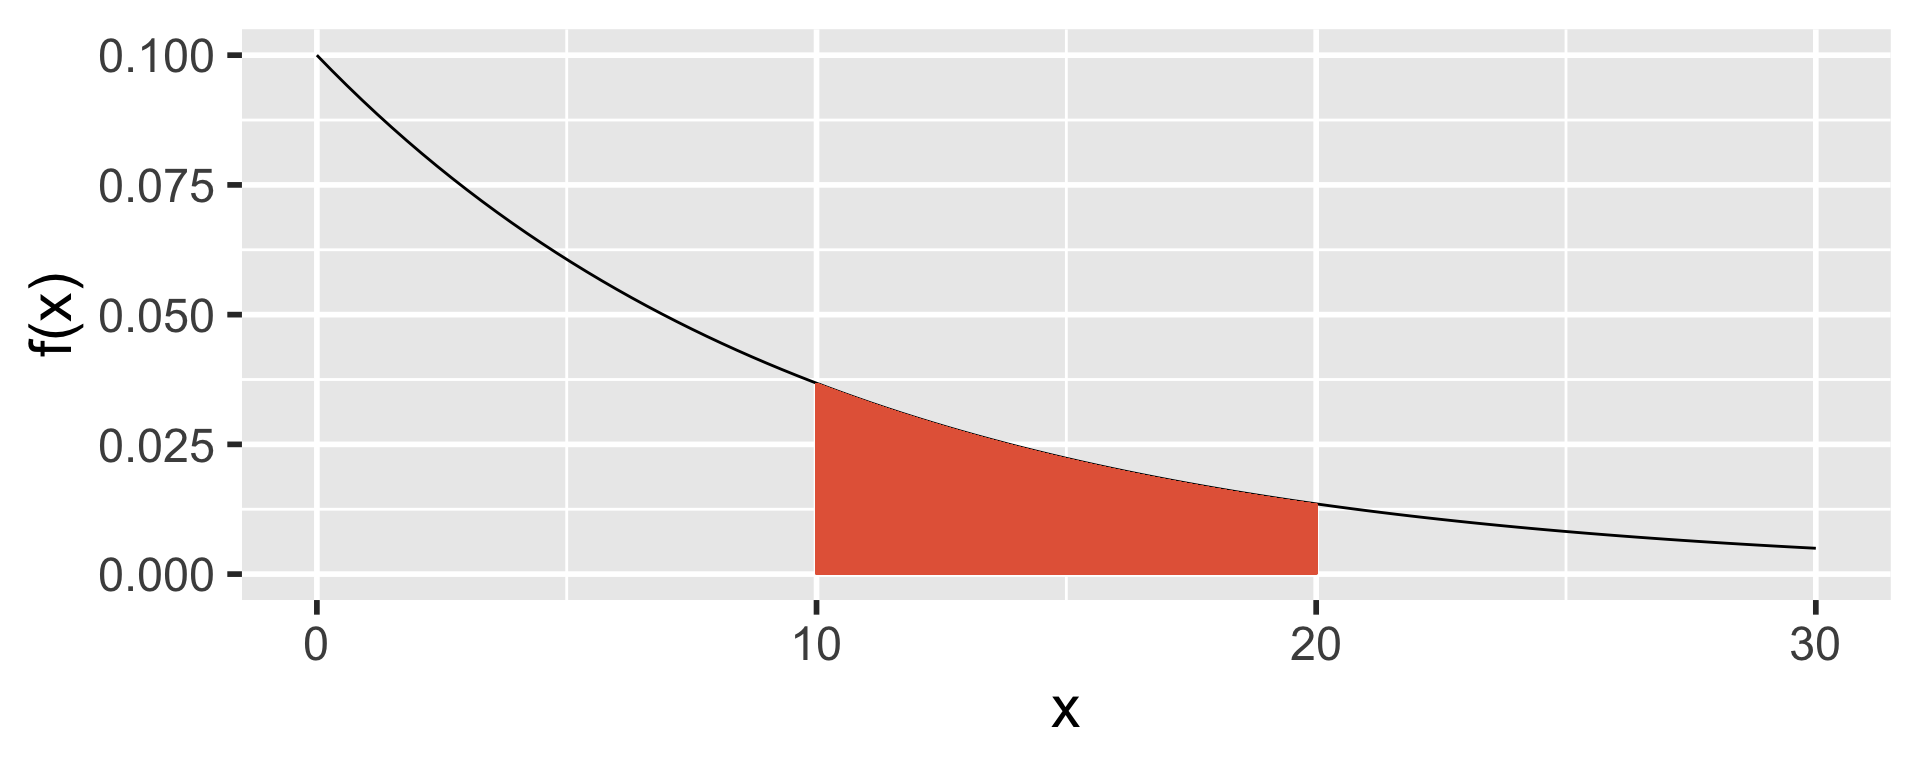
\(P(10<X<20) = ?\)
\(\int_{10}^{20}0.1 e^{-0.1 x}dx\)
\(P(X<20) - P(X<10)\)
Expected Value and Variance
What is the expected value of the waiting time for a bus?
\(E(X) = \frac{1}{\lambda}\)
\(E(X) = \frac{1}{0.1} = 10\) minutes
What is the variance of the waiting time for a bus?
\(Var(X) = \frac{1}{\lambda^2}\)
\(Var(X) = \frac{1}{0.1^2} = 100 \text{ minutes}^2\)
Poisson
Discrete
Number of events (bus)
Every ten minutes we expect 1 bus
Exponential
Continuous
Time between two events
We expect to wait 10 minutes for a bus
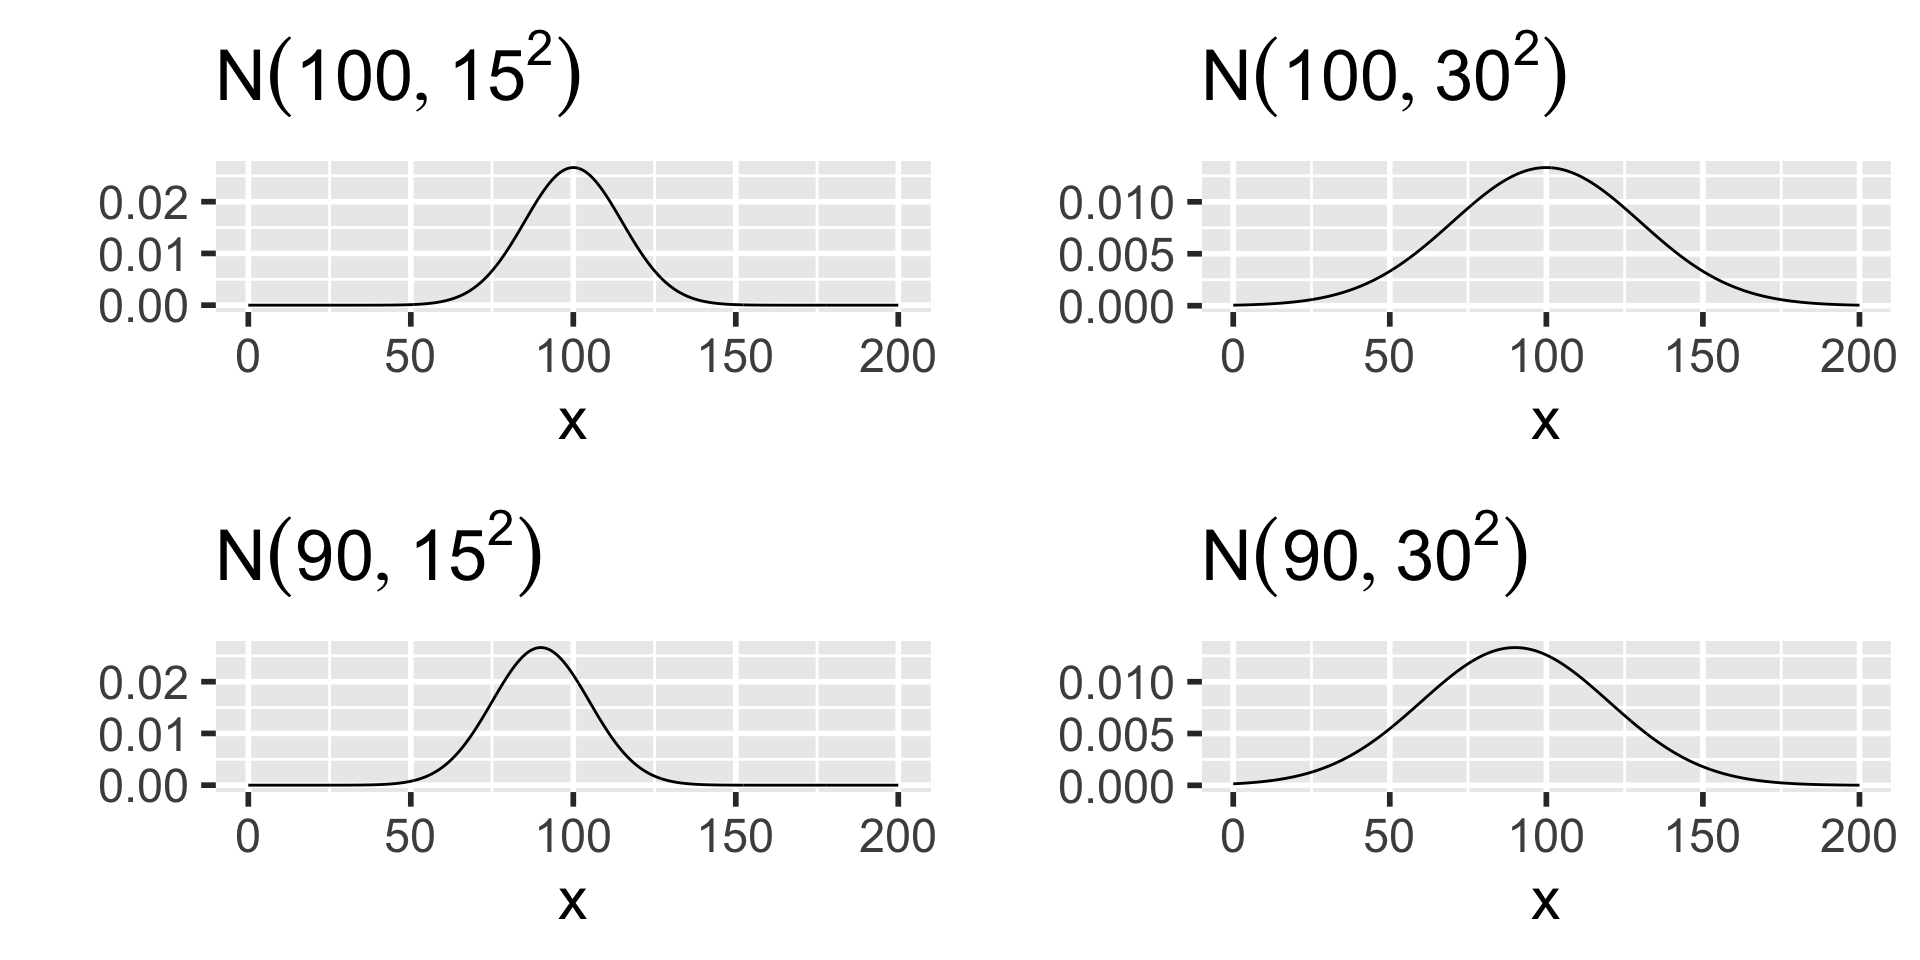
Normal Distribution
\(X \sim \mathcal{N}(\mu, \sigma^2)\)
\(f(x) = \frac{1}{\sigma \sqrt{2\pi}}{e^{-(x-\mu)^2/2\sigma^2}}\)
\(E(X) = \mu\)
\(Var(X) = \sigma^2\)
Characteristics
Mean = Median = Mode
\(P(X \leq \mu) = 0.5\)
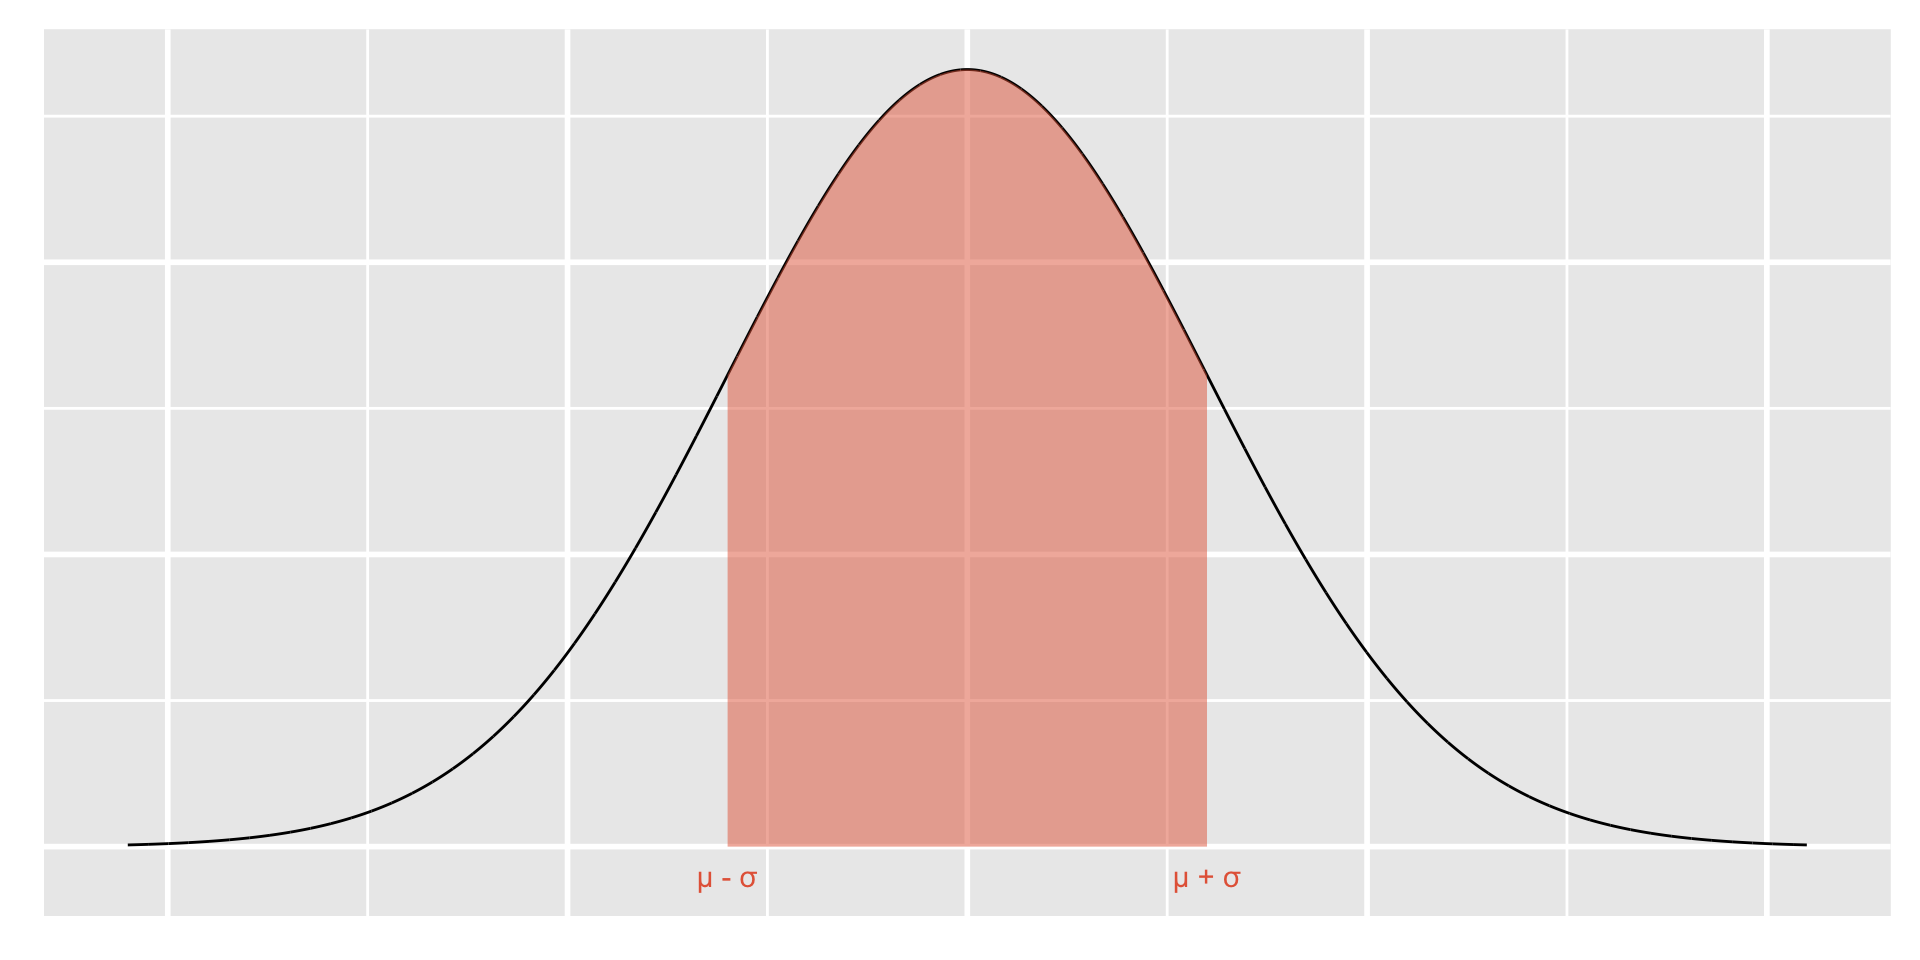
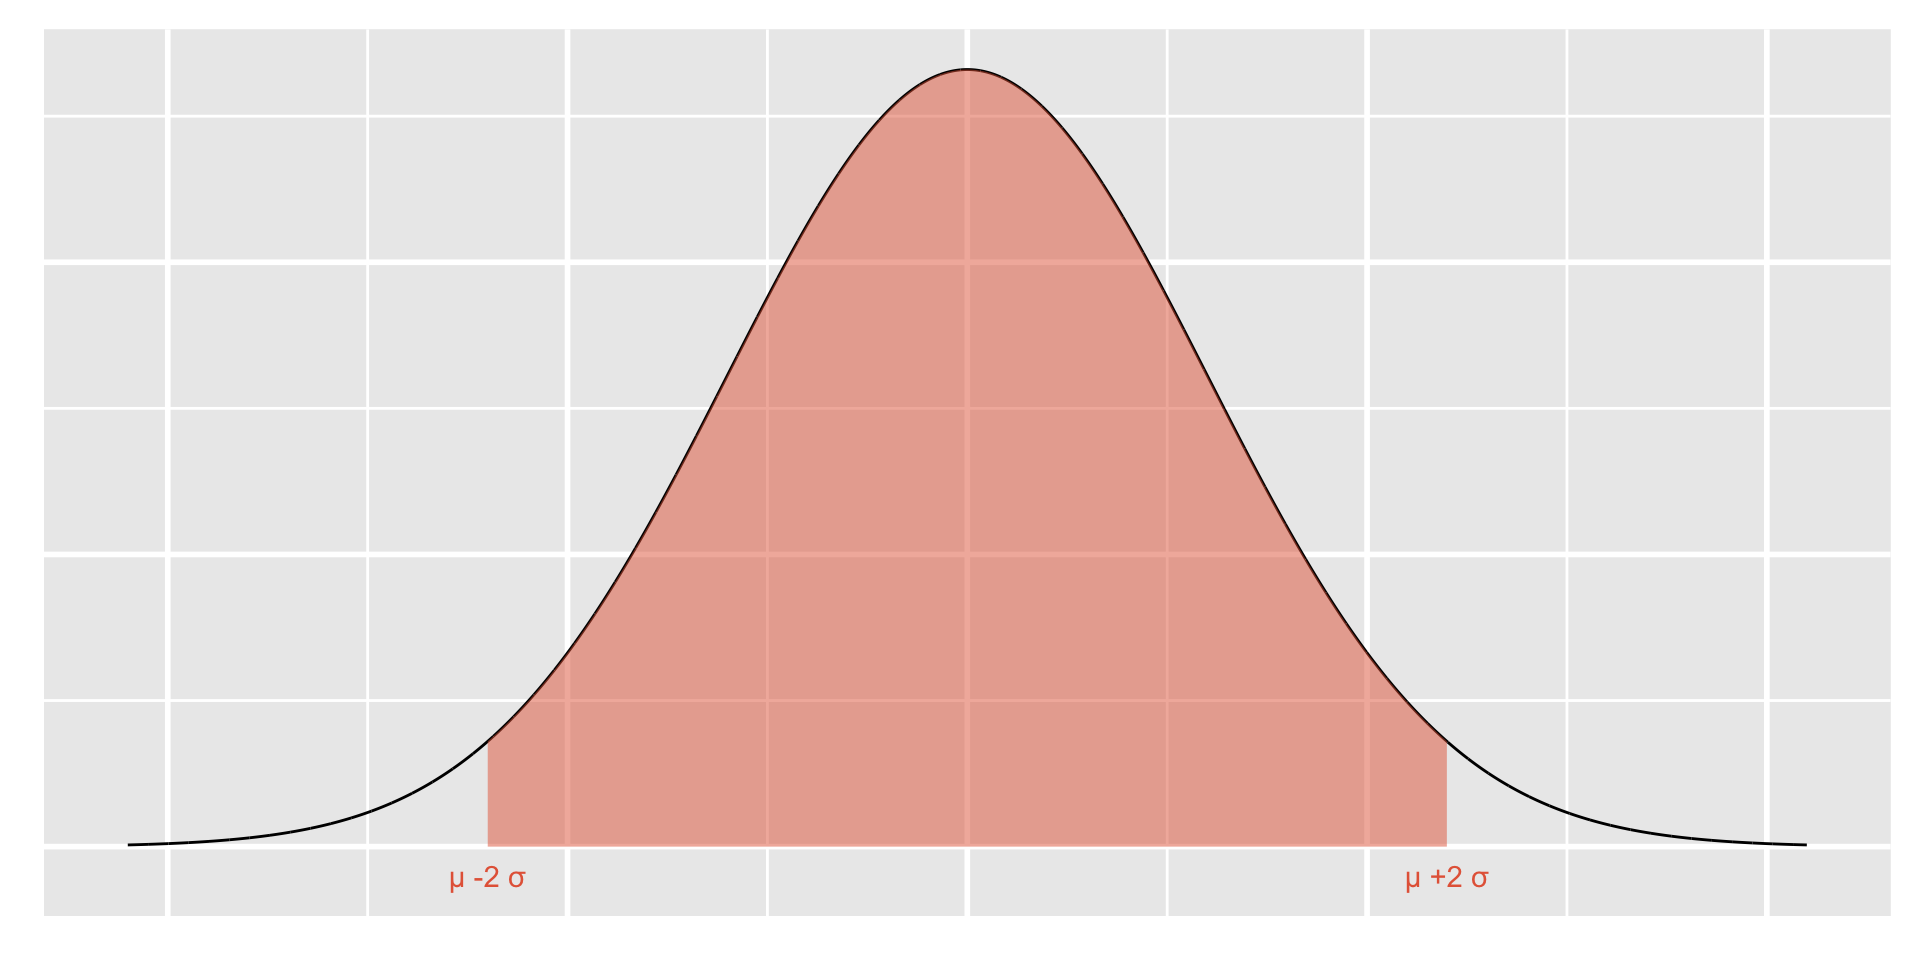
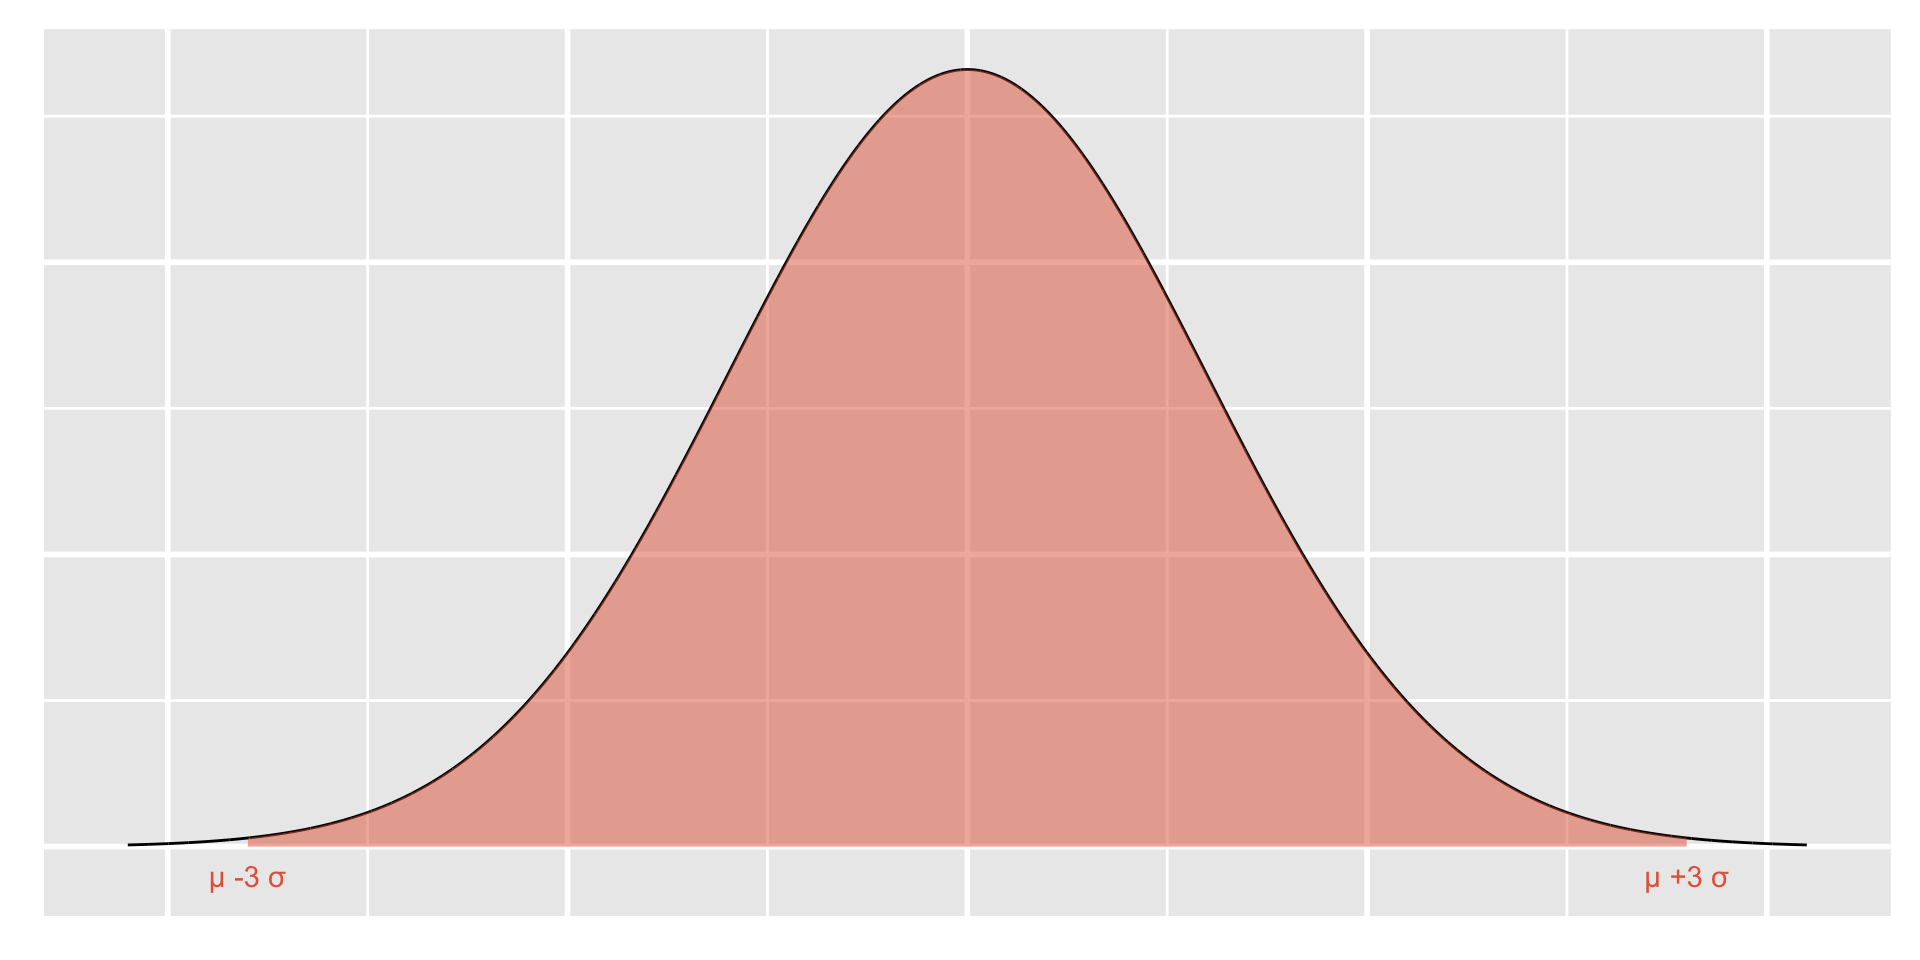
Parameters
68.26895% of the data are within 1 standard deviation of the mean.
95.44997% of the data are within 2 standard deviations of the mean.
99.73002% of the data are within 3 standard deviations of the mean.
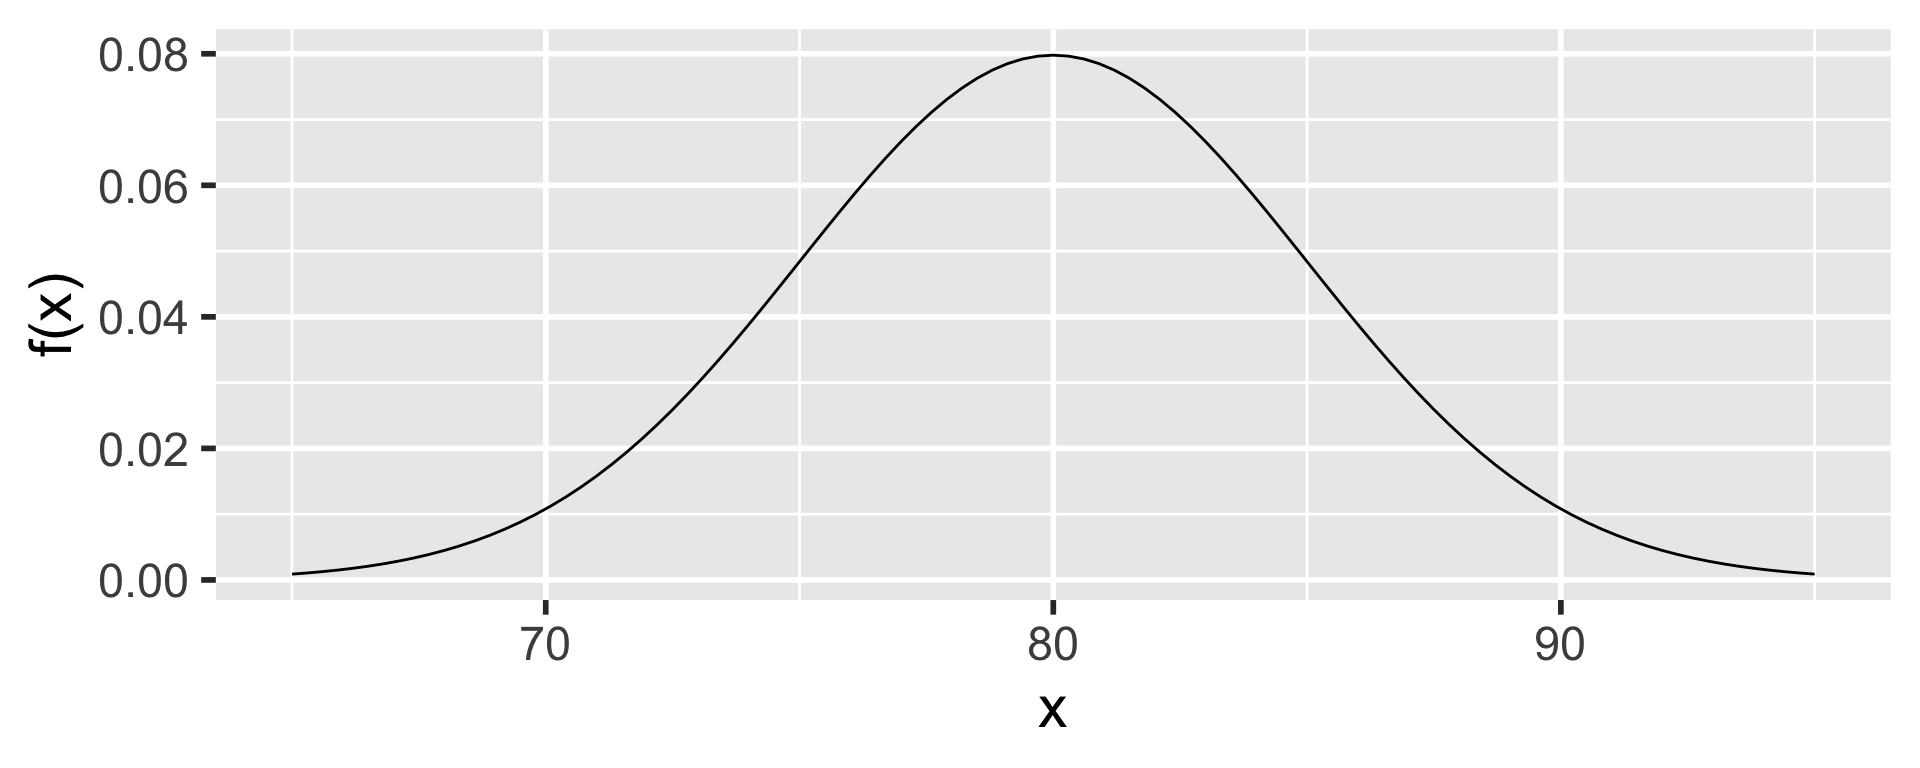
Example
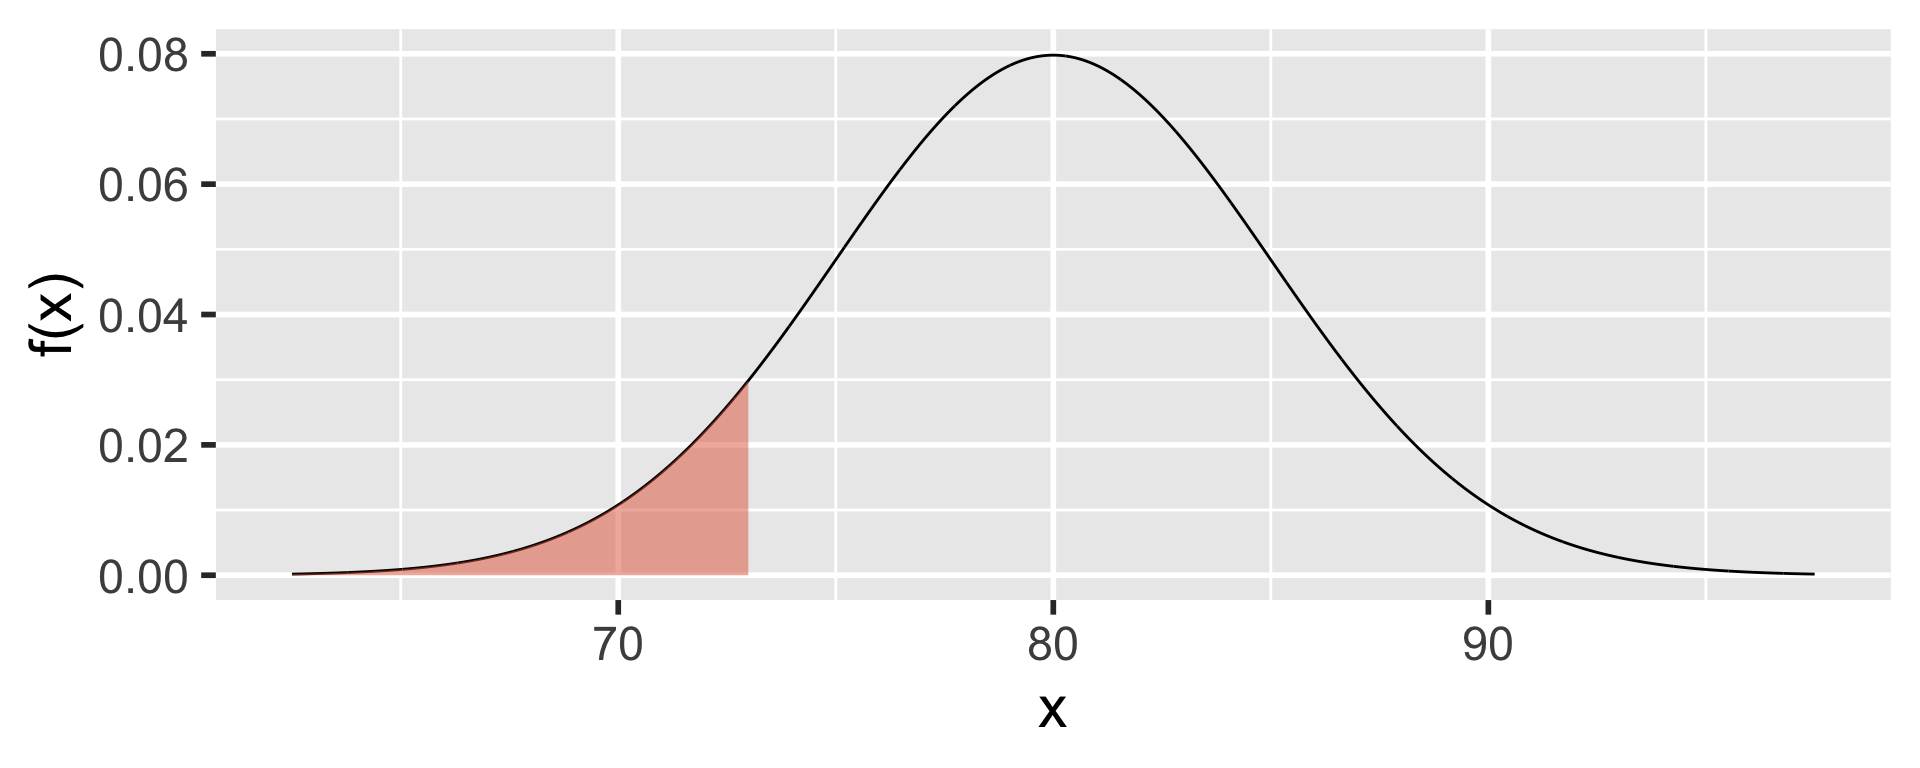
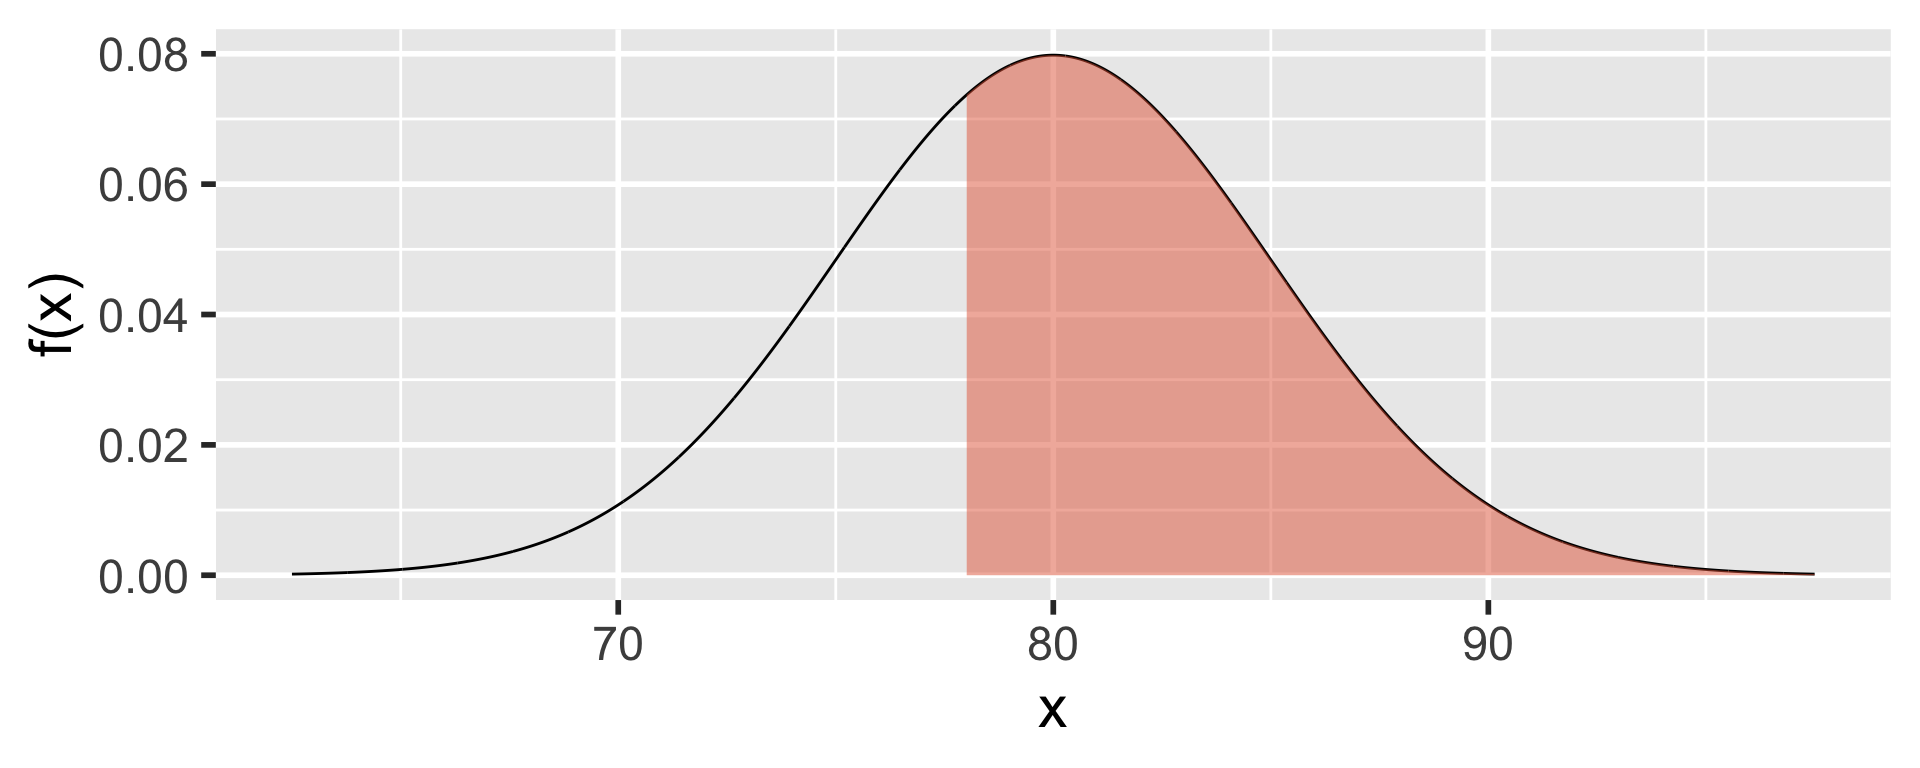
Midterm exam scores are normally distributed with a mean of 80 and standard deviation of 5 points.
\[X \sim N(80, 5^2)\]
Calculating Probability
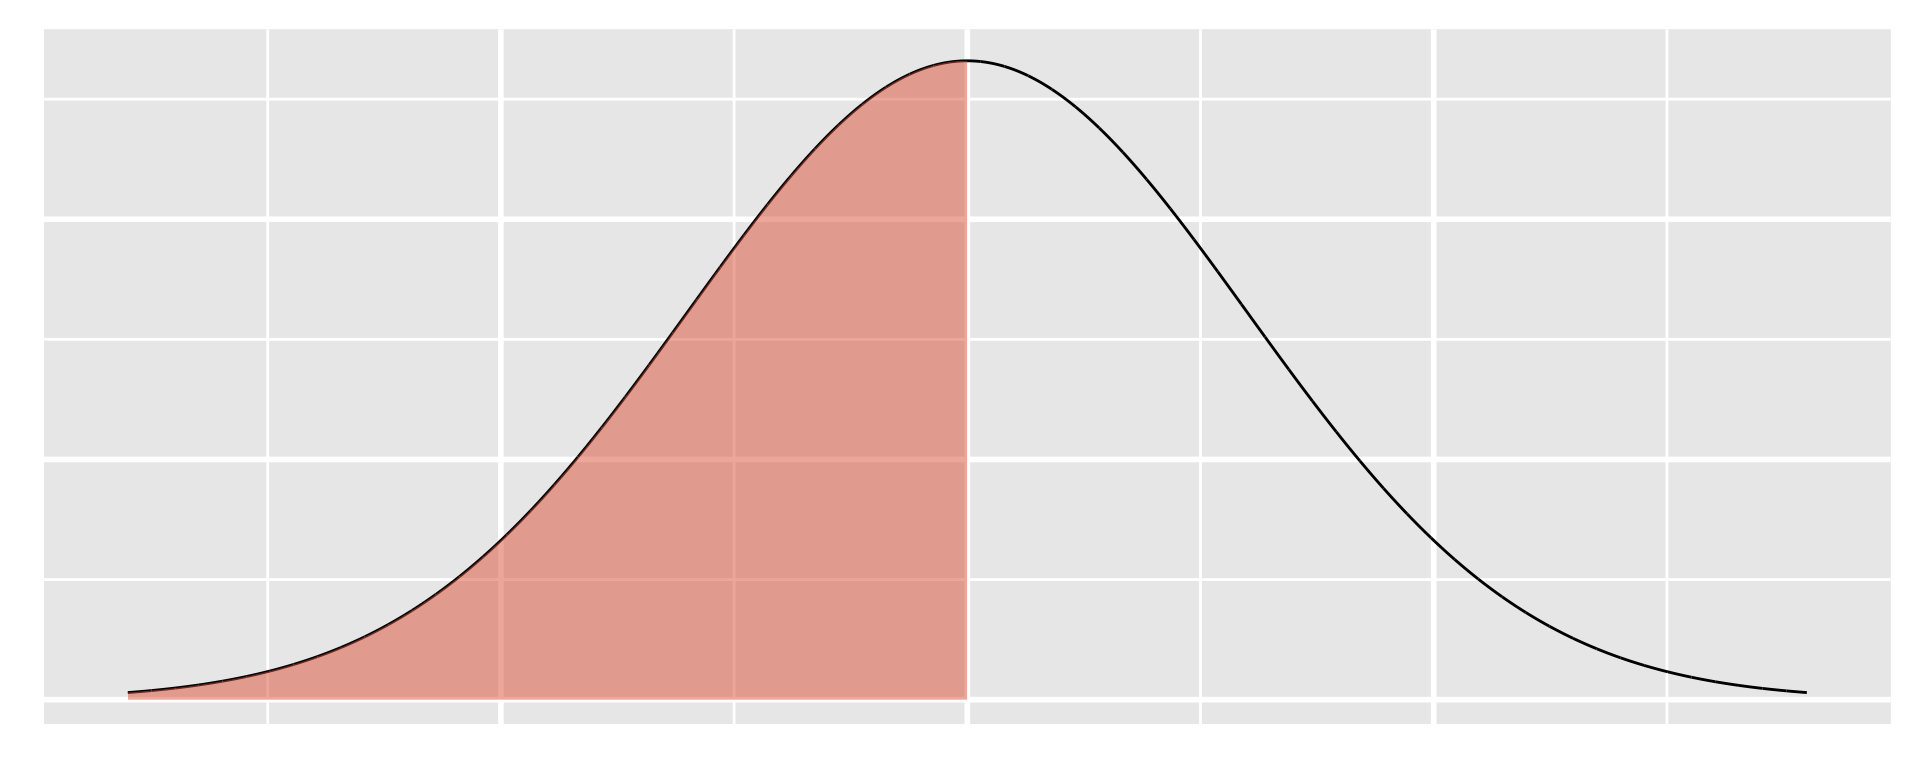
What is the probability that a student scores below 73 points?
Calculating Probability
What is the probability that a student scores above 78 points?
How many standard deviations away from the mean?
Krishna scored 85 points on the midterm. How many standard deviations is Krishna’s score away from the mean?
\(\frac{85-80}{5} = 1\)
Hira scored 77.5 points on the midterm. How many standard deviations is Hira’s score away from the mean?
\(\frac{77.5-80}{5} = -0.5\)
Z-score
\[Z = \frac{X-\mu}{\sigma} \]
Calculating z-scores
We can calculate Z-scores regardless of the distribution of the data. In other words, data do not need to be normally distributed. Z-scores only show how many standard deviations a value is away from the mean.
Interpreting z-scores
If we know that the data follow a normal distribution then we can use z-scores for probabilistic interpretations.
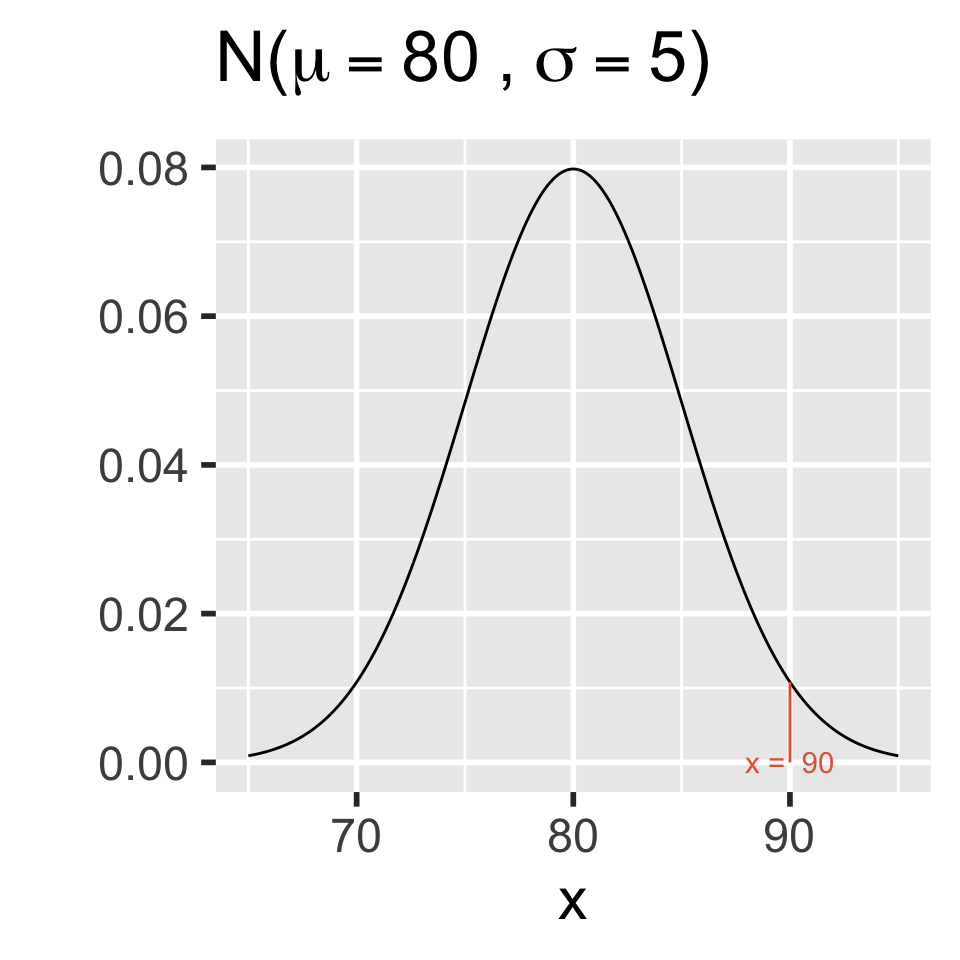
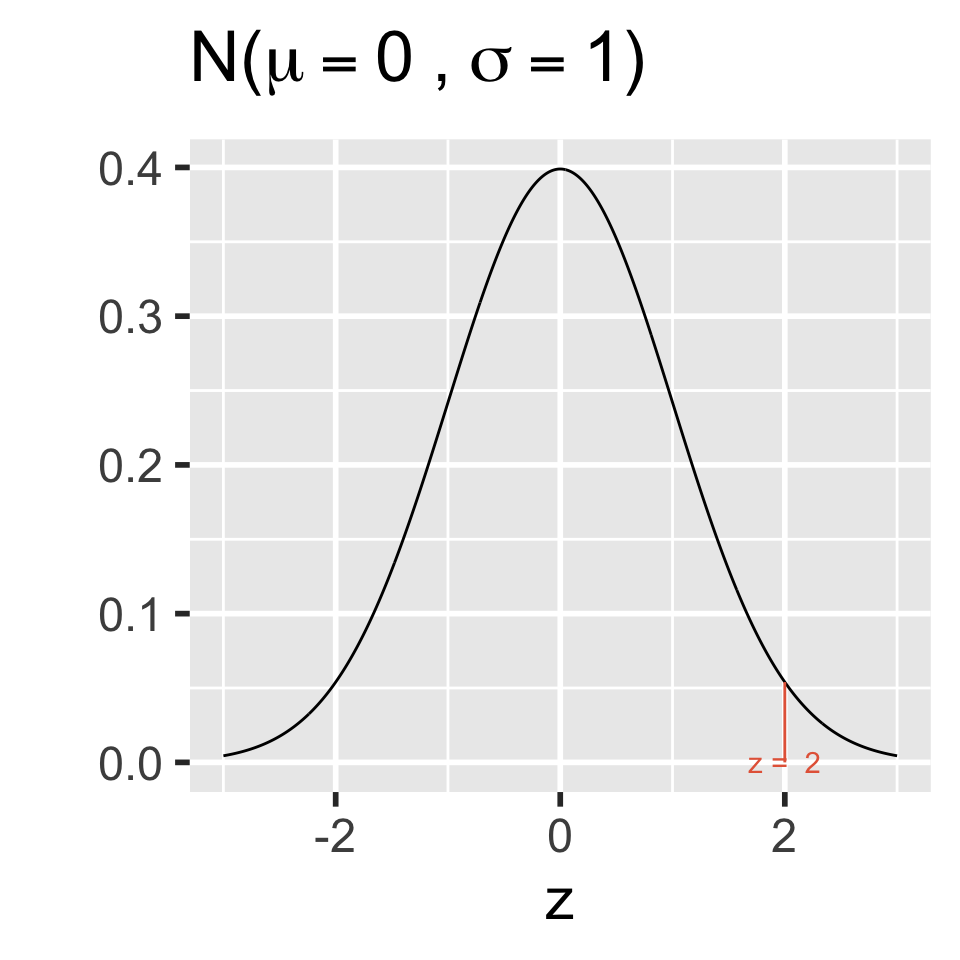
Normal Distribution vs. Standard Normal (z) Distribution
SAT scores - z scores
Let X represent the SAT scores and \(X \sim N(1100, 200^2)\)
What is the Z-score of a student who scores 1500?
\(z = \frac{1500-1100}{200} = 2\)
SAT scores - probability
What is the percentile rank of a student who scores 1500?
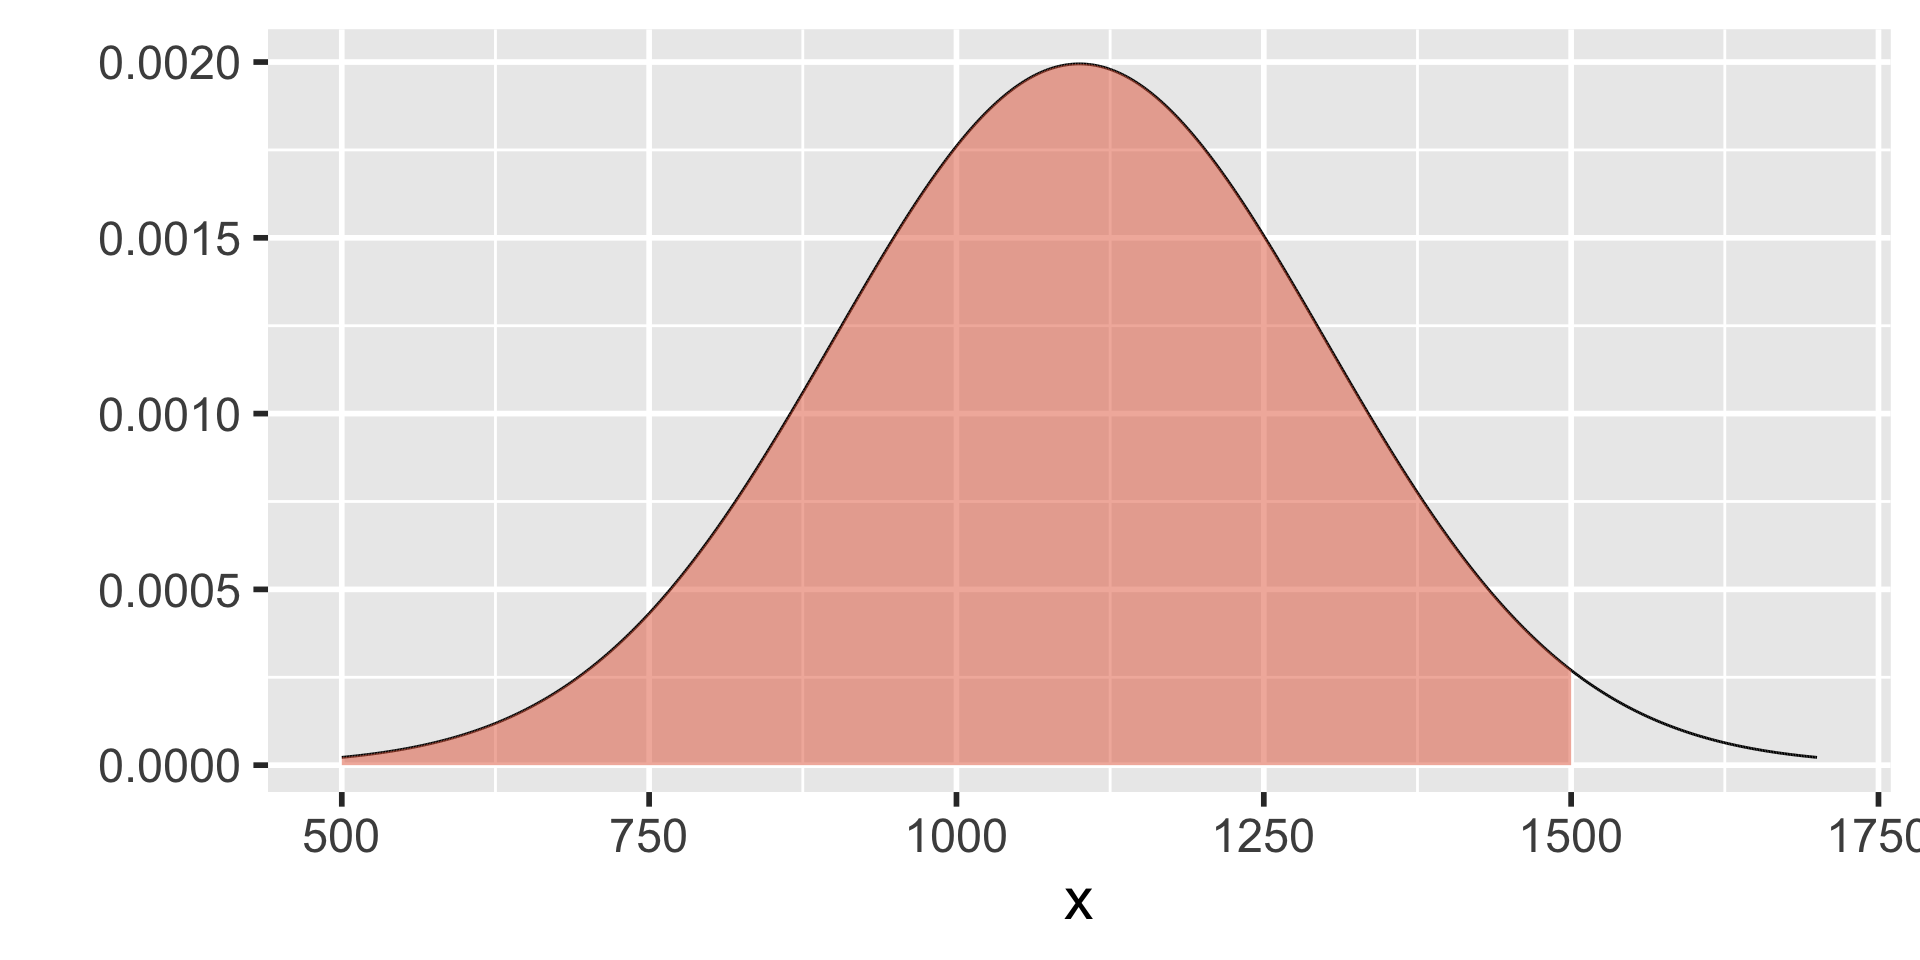
SAT scores - probability
What is the percentile rank of a student who scores 1500?
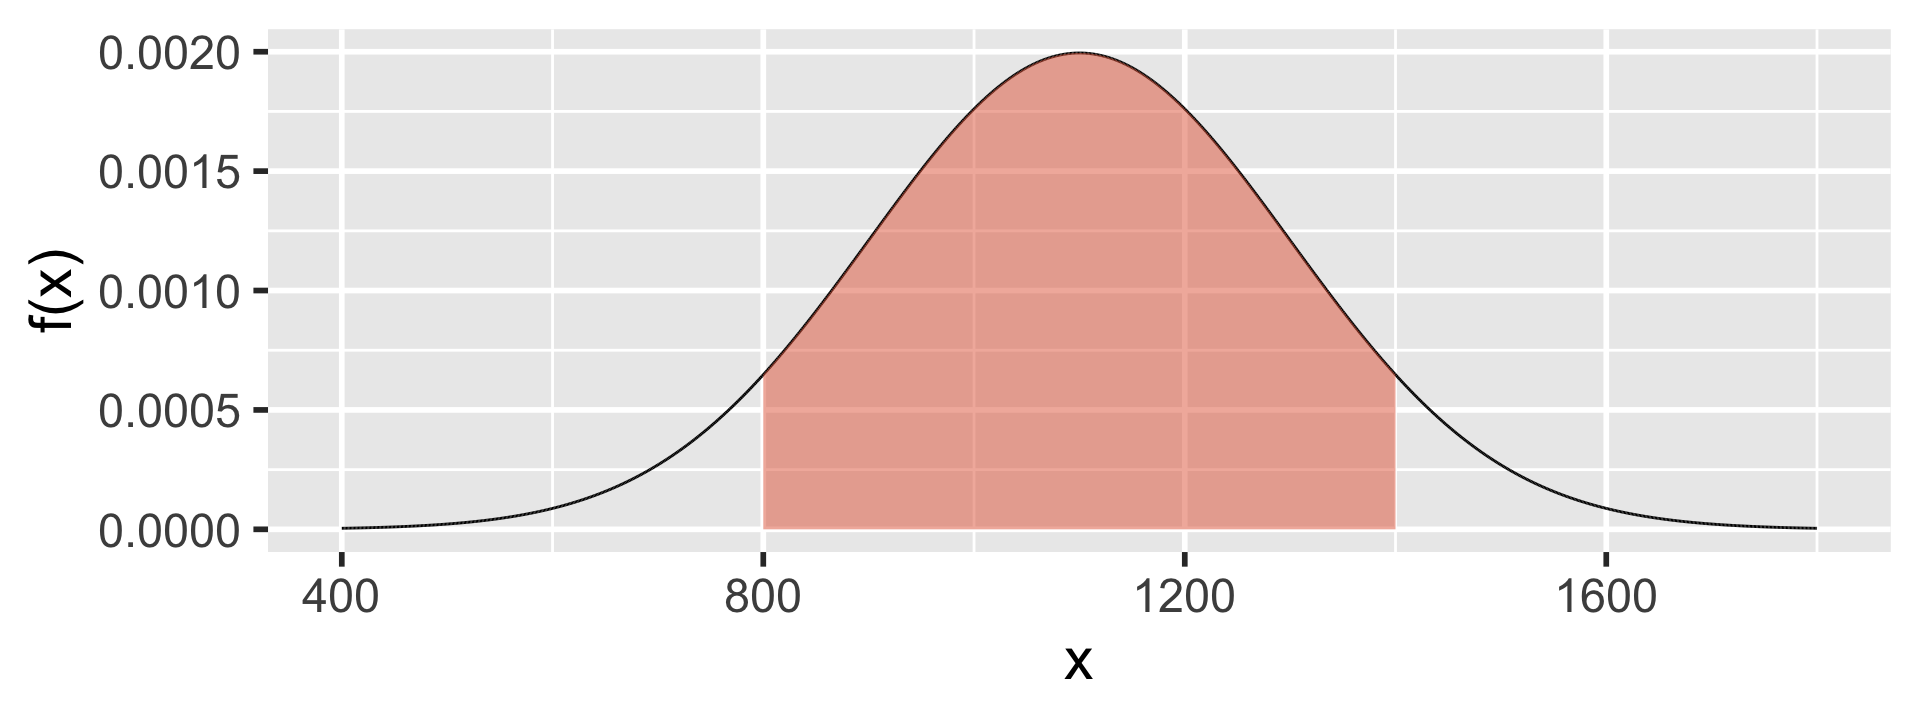
What percentage of test takers score between 800 and 1400?
\(P(800<X<1400) =P(X<1400) - P(X<800)\)
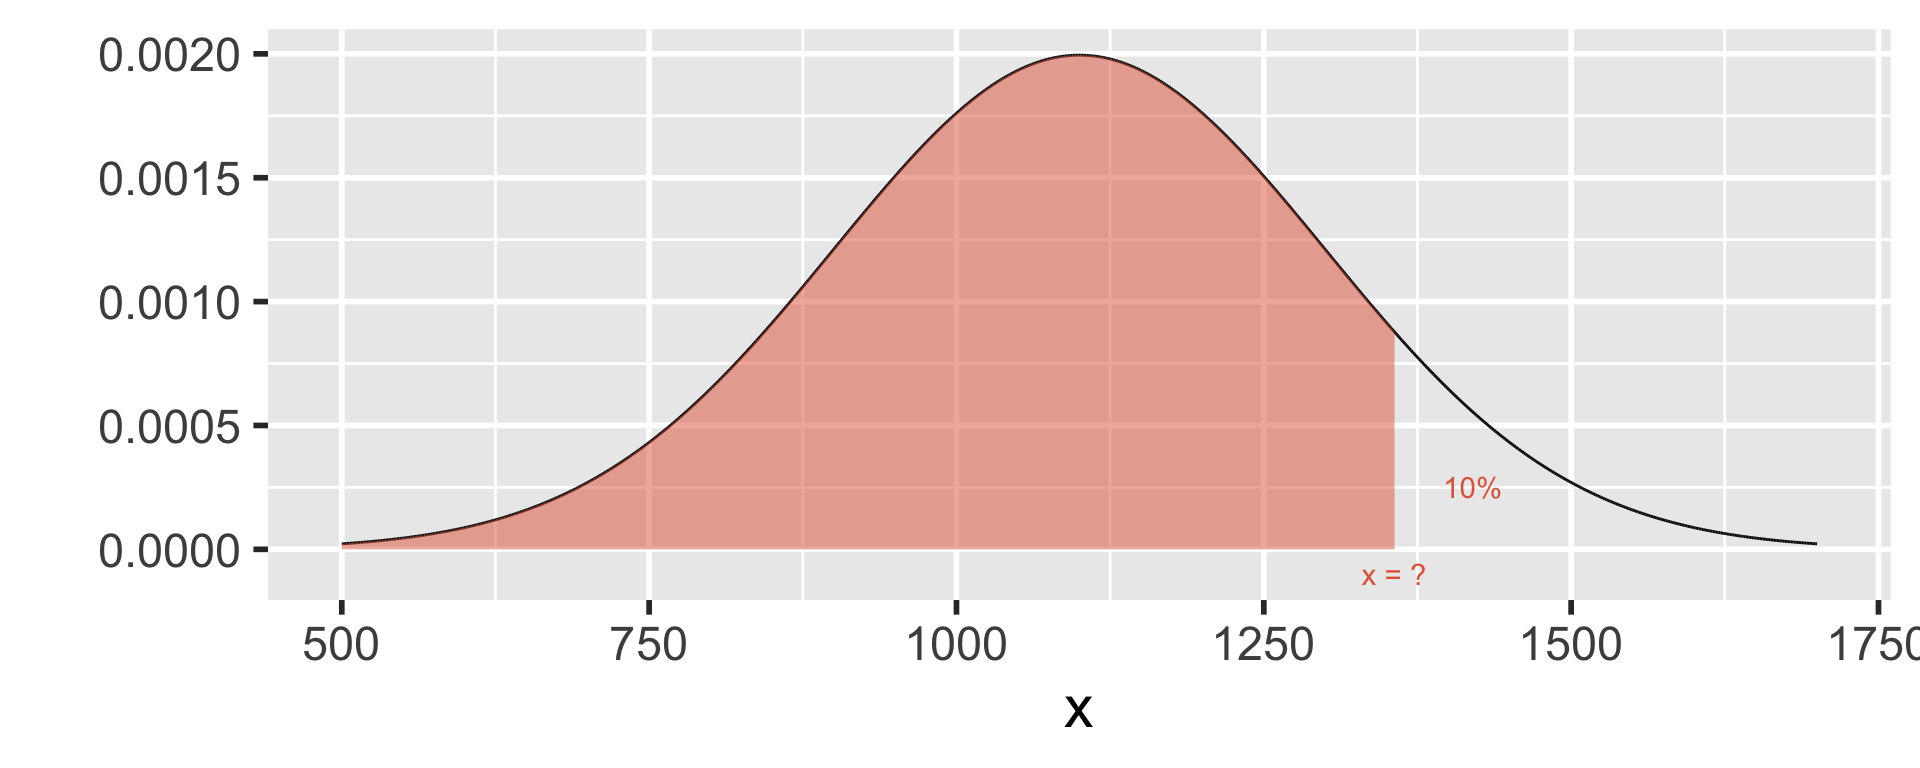
Known probability unknown x
If College Board wanted to send a congratulatory email to the top 10% in the SATs, above what SAT score should they consider sending the email to?
Continuous Uniform Distribution
\(X \sim \mathcal{U}(a,b)\)


Expected Value
\(E(X) = \int_{x \ \epsilon \ S_X} xf(x)dx\)
\(E(X) = \int_a^b x\frac{1}{b-a}dx\)
\(E(X) = \frac{1}{b-a} \big[\frac{x^2}{2}\bigg\rvert_a^b\big]\)
\(E(X) = \frac{1}{b-a} \big[\frac{b^2}{2} - \frac{a^2}{2}\big]\)
\(E(X) = \frac{b^2 - a^2}{2(b-a)}\)
\(E(X) = \frac{b+a}{2}\)
\(E(X^2)\)
\(Var(X) = E(X^2)- [E(X)]^2\)
\(E(X^2) = ?\)
\(E(X^2) = \int_a^b x^2\frac{1}{b-a}dx\)
\(E(X^2) = \frac{1}{b-a} \big[\frac{x^3}{3}\bigg\rvert_a^b\big]\)
\(E(X^2) = \frac{b^3 - a^3}{3(b-a)}\)
Variance
\(Var(X) = E(X^2)- [E(X)]^2\)
\(Var(X) = \frac{b^3 - a^3}{3(b-a)}- (\frac{b+a}{2})^2\)
\(Var(X) = \frac{(b-a) (b^2+ab+a^2)}{3(b-a)}- \frac{(b+a)^2}{4}\)
\(Var(X) = \frac{(b-a)^2}{12}\)
Example
A cellphone has a defective alarm system. Once every day the alarm starts ringing randomly. Let X be the random variable representing the time in the 24 hour system when the alarm goes on.

\(f(x) = \frac{1}{b-a} \text{ for } \ a \leq x \leq b\)
\(f(x) = \frac{1}{24-0} \text{ for } x \ \epsilon [0,24)\)

Calculating Probability
What is the probability that the phone alarm will ring at 3 am?

\(P(X = 3) = 0\)
\(\int_3^{3}\frac{1}{b-a}dx = 0\)
Calculating Probability
What is the probability that the phone alarm will ring at some time between midnight and 8 am?

Cumulative probability!
\(\int_0^{8}\frac{1}{b-a}dx\)
\(\frac{x}{b-a}\bigg\rvert_0^8 = \frac{8}{24} = \frac{1}{3}\)
Calculating Probability
What is the probability that the phone alarm will ring at some time between 2 am to 8 am?

\(P(2<X<8) = ?\)
\(\frac{x}{b-a}\bigg\rvert_2^8 = \frac{8}{24} - \frac{2}{24}= \frac{1}{4}\)
\(P(X<8) - P(X<2)\)
Expected Value
What is the expected value of the time that the phone alarm will go on?
\(E(X) = \frac{b+a}{2}\)
\(E(X) = \frac{24+0}{2} = 12\)
We found that the expected value is 12. Does that mean that every day we would expect the alarm to go on at noon (12 pm)?
No! Some days the alarm might go on at 9 am, some days at 3 pm (15). Some days it might go on at 9:15 pm (21.25). We would expect the average to be 12 in the long run.
Variance
We already pointed out that there is variance to the time the alarm goes on. It is not at noon every day. What is the variance of the time that the phone alarm will go on?
\(Var(X) = \frac{(b-a)^2}{12}\)
\(Var(X) = \frac{(24-0)^2}{12}\)
\(Var(X) = 48\)
Continous Distributions Dr. Mine Dogucu