[1] 1.959964Inference for Difference of Two Proportions
Dr. Mine Dogucu
Review of Inference for Single Proportion
Data Context
We will use the following excerpts from Gallup to understand the depression rate among U.S. adults in 2025 so far.
The percentage of U.S. adults who report currently having or being treated for depression has exceeded 18% in both 2024 and 2025, up about eight percentage points since the initial measurement in 2015. The current rate of 18.3% measured so far in 2025 projects to an estimated 47.8 million Americans suffering from depression. Most of the increase has occurred since the onset of the COVID-19 pandemic in 2020.
Data Context
Gallup obtained the most recent results for 2025 Feb. 18-26 and May 27-June 4, 2025, with 11,288 U.S. adults surveyed by web as part of the probability-based Gallup Panel
Questions - Confidence Interval
- What is the population parameter of interest?
- What is the point estimate of the parameter?
- Check if the conditions have been met to construct a confidence interval.
- Construct a 95% confidence interval.
Questions - Hypothesis Testing
- Write hypotheses testing whether the depression rate among U.S. adults is higher than 0.18.
- Write out the sampling distribution assuming that the null is true.
- If the null hypothesis were true, could we have observed a sample statistic like the one we observed or something more extreme? Calculate the \(p\)-value.
- Make a decision based on the \(p\)-value.
- Write a conclusion.
Questions - CI and HT relation
- Could we have come to the same hypotheses testing conclusion using the confidence interval only?
Confidence Interval
Example
Do those who take college level science courses and those who don’t have different rates of belief in life after death? Below are the responses from General Social Survey in 2018.
| Belief in Life After Death | |||
|---|---|---|---|
| Yes |
No |
||
|
College Science Course |
Yes | 375 | 75 |
| No | 485 | 115 | |
Understanding the Question
Response: Belief in Life After Death (categorical)
Explanatory: College Science Course
What did we observe?
Belief in Life After Death Among College Science Course Takers
\(p_{science} = \frac{375}{375+75} = 0.8333333\)
\(n_{science} = 450\)
Belief in Life After Death Among Non - College Science Course Takers
\(p_{noscience} = \frac{485}{485+115} = 0.8083333\)
\(n_{noscience} = 600\)
What did we observe?
It seems like there are more after life believers among college science course takers (~83%) when compared to those who did not take college science course (~80.83%). But now that we have taken statistics course we cannot only rely on comparison of sample statistics. We know we have to think about population parameters.
CLT for two proportions
If conditions are met then according to CLT \((p_1 - p_2) \sim \text{approximately } N(\pi_1 - \pi_2, {\frac{\pi_1(1-\pi_1)}{n_1} + \frac{\pi_2(1-\pi_2)}{n_2}})\)
Recall that the standard deviation of the the sampling distribution is the standard error.
Standard error for difference of two proportions
\(\sqrt{\frac{p_1(1-p_1)}{n_1} + \frac{p_2(1-p_2)}{n_2}}\)
Conditions
Independence: Within each group data have to be independent from each other. The two groups have to be independent from one another.
GSS utilizes some form of random sampling so we would expect independence within each group. People either have taken a college level science class or they have not taken so we can assume that the groups are independent from one another.
There needs to be at least 10 successes and 10 failures in each group.
We have seen that all the values in the contingency table were greater than 10.
Confidence Interval Construction
CI = \(\text{point estimate} \pm \text { critical value} \times \text{standard error}\)
CI for difference of two proportions = \(p_1 - p_2 \pm \text { critical value} \times \sqrt{\frac{p_1(1-p_1)}{n_1} + \frac{p_2(1-p_2)}{n_2}}\)
Steps
- Calculate point estimate.
- Calculate critical value.
- Calculate standard error.
- Construct the confidence interval.
CI for difference of two proportions = \(p_1 - p_2 \pm \text { critical value} \times \sqrt{\frac{p_1(1-p_1)}{n_1} + \frac{p_2(1-p_2)}{n_2}}\)
CI for difference of two proportions = \(p_1 - p_2 \pm \text { critical value} \times \sqrt{\frac{p_1(1-p_1)}{n_1} + \frac{p_2(1-p_2)}{n_2}}\)
[1] -0.02516763[1] 0.0685676395%CI for difference of two proportions is (-0.025,0.069)
Hypothesis Testing
Steps
- Set hypotheses
- Identify Sampling Distribution of \(H_0\)
- Calculate p-value
- Make a Decision and a Conclusion.
Example
Is there a relationship between taking a college level science class and belief in life after death?
Step 1. Set hypotheses
\[H_0: \pi_1 = \pi_2\]
\[H_A: \pi_1 \neq \pi_2\]
Step 2. Identify Sampling Distribution of \(H_0\)
If conditions are met then according to CLT \((p_1 - p_2) \sim \text{approximately } N(\pi_1 - \pi_2, {\frac{\pi_1(1-\pi_1)}{n_1} + \frac{\pi_2(1-\pi_2)}{n_2}})\)
Assuming that the null is true then \[\pi_1 = \pi_2\] so we cannot use different \(p_1\) and \(p_2\) in place of \(\pi_1\) and \(\pi_2\).
Pooled estimate of a proportion when \(H_0: \pi_1 = \pi_2\)
\(p_{pooled} = \frac{\text{number of total successes}}{\text{number of total cases}} = \frac{p_1n_1+p_2n_2}{n_1+n_2}\)
\(SE = \sqrt{\frac{p_{pooled}(1-p_{pooled})}{n_1}+\frac{p_{pooled}(1-p_{pooled})}{n_2}}\)
We also use the pooled proportion when checking conditions for success-failure counts.
Calculating pooled proportion
\(p_{pooled} = \frac{\text{number of total successes}}{\text{number of total cases}} = \frac{p_1n_1+p_2n_2}{n_1+n_2}\)
Calculating standard error
\(SE = \sqrt{\frac{p_{pooled}(1-p_{pooled})}{n_1}+\frac{p_{pooled}(1-p_{pooled})}{n_2}}\)
Step 3. Calculate p-value
How likely are we to observe a difference of proportions in samples that is at least as extreme as (0.0217)?
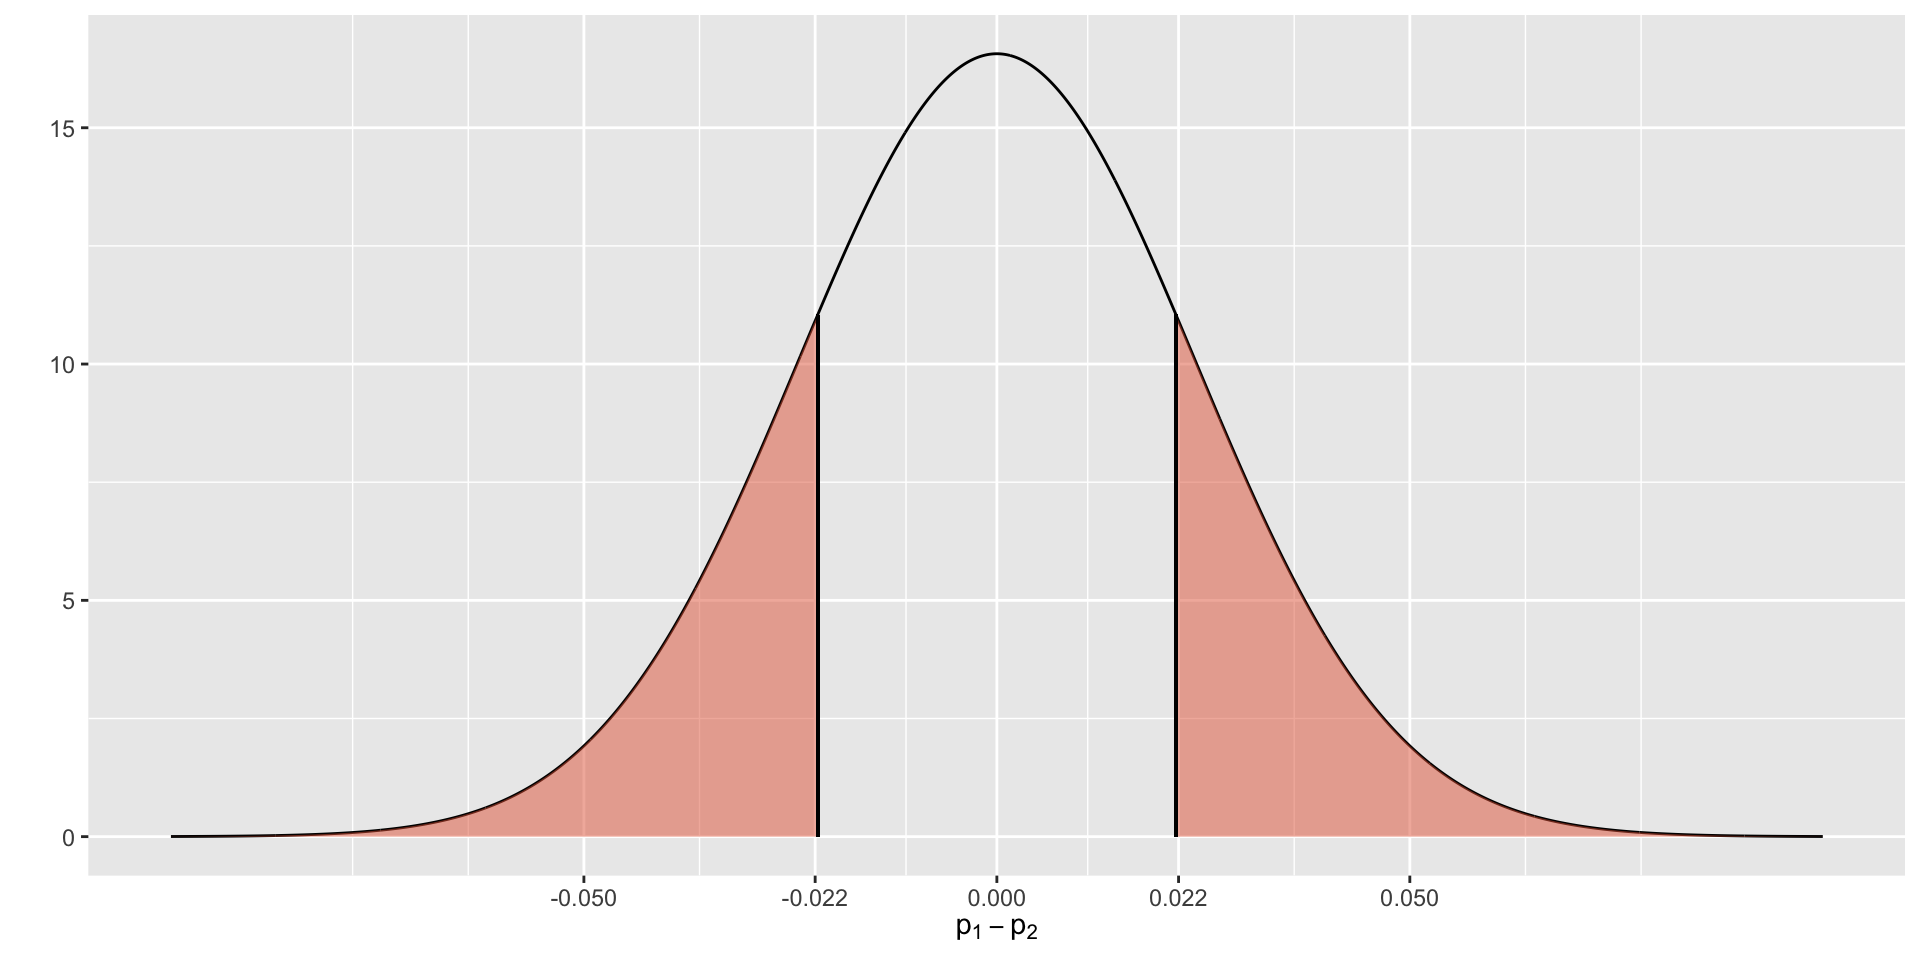
If the null hypothesis is true then
[1] 0.1837725Step 4. Make a Decision and a Conclusion.
If the null hypothesis were true ( \(\pi_1 - \pi_2 = 0\) ) then the probability of observing a difference of proportions in the sample that is at least extreme as 0.0217 would be 0.37. In other words, p-value = 0.37 which is not less than 0.05. This implies that the observed value ( \(p_1 - p_2 = 0.0217\) ) is not significantly different than 0. We fail to reject the null.
Step 4. Make a Decision and a Conclusion.
We did not find any evidence against the null. We cannot conclude anything about the relationship between the college science class taking and belief in life after death. In other words, we don’t know if there is any significant difference in proportion of life after death believers among those who have taken a college science class and those who have not.
Additional Exercises
From OpenIntro
6.20 6.26a 6.28 6.30